4.2 Computing Mean Average Precision (mAP) and Top-k Accuracy for our Retrieval System
We’ll use every IMAGE_STEP-th image in the validation + test dataset as a query. For each query:
Retrieve all images, rank them by similarity.
Compute average precision for each query.
Take the mean across all queries => mAP. This takes into consideration the ranking of the images.
We will evaluate top 1 accuracy and top-k accuracy.
1. Import Necessary Libraries
import matplotlib.pyplot as plt
import numpy as np

from pyvisim.datasets import OxfordFlowerDataset
from pyvisim.eval import top_k_accuracy, top_k_map
from pyvisim.neural_networks import ClipEmbedder
from pyvisim.retrieval.image_store import InMemoryImageEmbeddingStore
/home/runner/work/Python-Visual-Similarity/Python-Visual-Similarity/.venv/lib/python3.10/site-packages/tqdm/auto.py:21: TqdmWarning: IProgress not found. Please update jupyter and ipywidgets. See https://ipywidgets.readthedocs.io/en/stable/user_install.html
  from .autonotebook import tqdm as notebook_tqdm
Hyperparameters
Note
IMAGE_STEP keeps every IMAGE_STEP-th training image in the image store and every IMAGE_STEP-th validation and test image as a query. Set to 1 if you want to use all images.
IMAGE_STEP = 4
Helper functions
def plot_and_save_barplot(
    data: dict[str, list[float]],
    bar_labels: list[str],
    title: str = "Barplot",
    xlabel: str = "X-axis",
    ylabel: str = "Y-axis",
    save_path: str | None = None,
    show: bool = True,
) -> None:
    """
    Plot and save a barplot.

    :param data: Dictionary containing data to plot.
    :param bar_labels: Labels that will be displayed in the legend.
    :param title: Title of the plot.
    :param xlabel: Label for the x-axis.
    :param ylabel: Label for the y-axis.
    :param save_path: Path to save the plot image. If None, plot is not saved.
    :param show: Whether to display the plot.
    """
    x_labels = list(data.keys())
    values = list(data.values())
    num_groups = len(values[0])

    if not all(len(v) == num_groups for v in values):
        raise ValueError(
            "All lists in data must have the same length as the number of bar labels."
        )

    x = np.arange(len(x_labels))  # the label locations
    width = 0.8 / num_groups  # width of each bar

    plt.figure(figsize=(10, 6))

    for i in range(num_groups):
        heights = [v[i] for v in values]
        plt.bar(x + i * width, heights, width, label=bar_labels[i])

    plt.title(title)
    plt.xlabel(xlabel)
    plt.ylabel(ylabel)
    plt.xticks(x + width * (num_groups - 1) / 2, x_labels)  # Center the tick labels
    plt.legend()
    plt.grid(axis="y", linestyle="--", alpha=0.6)

    if save_path:
        plt.savefig(save_path)

    if show:
        plt.show()

    plt.close()
2. Declare Datasets
train_dataset = OxfordFlowerDataset(purpose="train")
val_dataset = OxfordFlowerDataset(purpose=["validation", "test"])

train_indices = range(0, len(train_dataset), IMAGE_STEP)
val_indices = range(0, len(val_dataset), IMAGE_STEP)
print("Number of images in the store:", len(train_indices))
print("Number of queries:", len(val_indices))
Number of images in the store: 1538
Number of queries: 510
3. Load the ClipEmbedder
We will load the embedder on the pre-trained openai weights from the ViT-B/32 variant.
embedder = ClipEmbedder(variant="ViT-B/32", pretrained="openai")
4. Performance metrics
First, we prepare the data. The selected training images are embedded and indexed in an InMemoryImageEmbeddingStore, from which the most similar images are retrieved for each query.
train_paths = [train_dataset.image_paths[i] for i in train_indices]
store = InMemoryImageEmbeddingStore(image_paths=train_paths, embedder=embedder)
store.build_store()
dataset_labels_dict = dict(
    zip(train_dataset.image_paths, train_dataset.labels, strict=True)
)
val_labels = [val_dataset.labels[i] for i in val_indices]
5.1. Top-k accuracy
How it works:
For each query, retrieve top-k most similar images.
If any of them share the same label as the query, that counts as correct.
The final accuracy is
num_correct_queries / num_queries.
Let’s compute the top-1 accuracy (the most relevant match has to be the correct one):
# Top-1 Accuracy for CLIP
acc_k1_clip = top_k_accuracy(
    images=(val_dataset[i][0] for i in val_indices),
    image_labels=val_labels,
    store=store,
    path_labels_dict=dataset_labels_dict,
    k=1,
)
print("Top-1 Accuracy, CLIP:", acc_k1_clip)
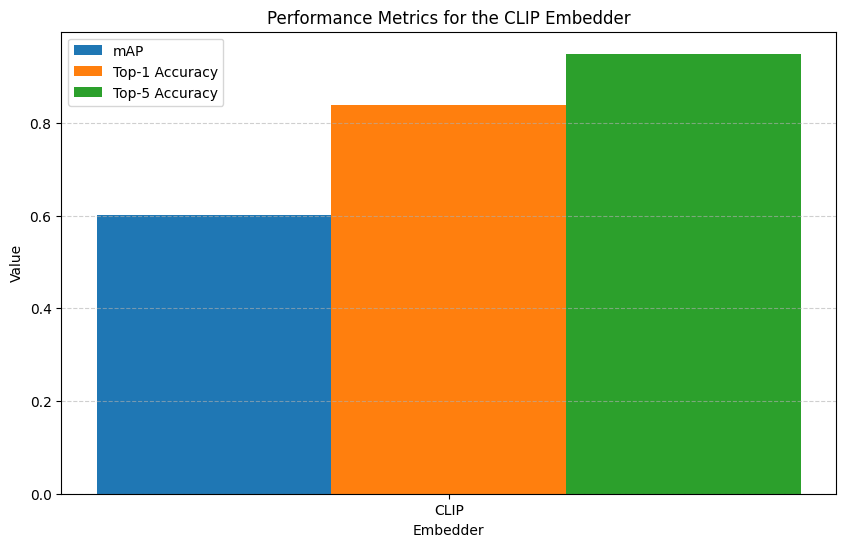
Top-1 Accuracy, CLIP: 0.8392156862745098
Normally, we might also consider the second, third and so on.. most relevant results. In this case, we can set k > 1. Let’s try for k=5:
# Top-5 Accuracy for CLIP
acc_k5_clip = top_k_accuracy(
    images=(val_dataset[i][0] for i in val_indices),
    image_labels=val_labels,
    store=store,
    path_labels_dict=dataset_labels_dict,
    k=5,
)
print("Top-5 Accuracy, CLIP:", acc_k5_clip)
Top-5 Accuracy, CLIP: 0.9490196078431372
5.2. Compute the mAP
How it works:
If
kis given, we only consider thetop-kranked results per query.if
k=Noneor omitted, we consider all results (the entire dataset).For each query, we compute average precision (AP). Then we average across all queries, yielding mean average precision (mAP).
Example:
Image a has label 1, and the top-6 retrieved images have labels:
Truth Labels: [0, 1, 1, 0 ,0, 1]
a) k=None: we consider all results.
Rank 2: Precision = 1/2
Rank 3: Precision = 2/3
Rank 6: Precision = 3/6
AP = (1/2 + 2/3 + 3/6) / 3 = 0.556
b) k=3:
Rank 2: Precision = 1/2
Rank 3: Precision = 2/3
AP = (1/2 + 2/3) / 2 = 0.583
First, we do it for the whole dataset:
# mAP for CLIP
mAP_value_clip = top_k_map(
    images=(val_dataset[i][0] for i in val_indices),
    image_labels=val_labels,
    store=store,
    path_labels_dict=dataset_labels_dict,
)
print("Mean Average Precision (mAP), CLIP:", mAP_value_clip)
Mean Average Precision (mAP), CLIP: 0.6021367064954185
Normally, we might only care about the top results. Let’s compute the mAP for the top 5 results:
# mAP of the top-5 results for CLIP
mAP_value_top5_clip = top_k_map(
    images=(val_dataset[i][0] for i in val_indices),
    image_labels=val_labels,
    store=store,
    path_labels_dict=dataset_labels_dict,
    k=5,
)
print("Mean Average Precision (mAP) for Top-5, CLIP:", mAP_value_top5_clip)
Mean Average Precision (mAP) for Top-5, CLIP: 0.6642418300653594
# Plot a bar chart of the mAP and top-k accuracy of the embedder.
plot_and_save_barplot(
    {"CLIP": [mAP_value_clip, acc_k1_clip, acc_k5_clip]},
    bar_labels=["mAP", "Top-1 Accuracy", "Top-5 Accuracy"],
    title="Performance Metrics for the CLIP Embedder",
    ylabel="Value",
    xlabel="Embedder",
)